
Things I want to do
When implementing an HTTP server with Node.js, I debug it using Visual Studio Code.
Environment
Node.js v20.16.0
VisualStudioCode 1.94.2
debug
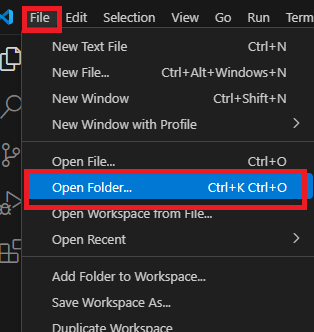
Select ‘Open Folder…’ from the File menu to open the folder containing your project.
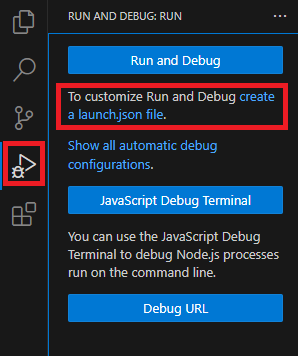
Click ‘Run and Debug’ on the left side of the screen, then click ‘Create a Launch.json file’.
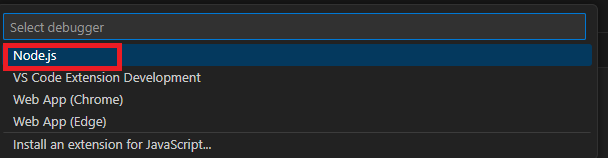
A dropdown menu will appear at the top of the screen; select Node.js.
After a short wait, a Launch.json file will be created in the project folder/.vscode with the following content.
The value of `program:` will vary depending on the project. Also, if it is a different file from the server-side entry point, it will be rewritten to the JavaScript file of the server-side entry point.
{
// Use IntelliSense to learn about possible attributes.
// Hover to view descriptions of existing attributes.
// For more information, visit: https://go.microsoft.com/fwlink/?linkid=830387
"version": "0.2.0",
"configurations": [
{
"type": "node",
"request": "launch",
"name": "Launch Program",
"skipFiles": [
"<node_internals>/**"
],
"program": "${workspaceFolder}\\server.mjs"
}
]
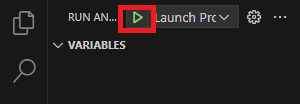
}Running the application
Click the Launch Program icon in the upper left corner of the screen.
Debug
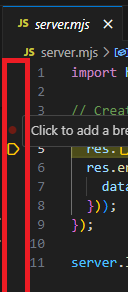
You can set a breakpoint by clicking to the left of the line number in the code.
After breaking, you can view the call stack and variables, similar to Chrome’s Developer Tools.
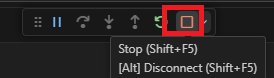
Exit the app
Clicking the Stop icon at the top of the screen will close the application.
Result
I was able to debug the server-side code in Node.js.
Websites I used as references


コメント